
Data Science 101: Feature Selection in Machine Learning - Part 2
Chi-Square, ANOVA, and Mutual Information Methods for Feature Selection

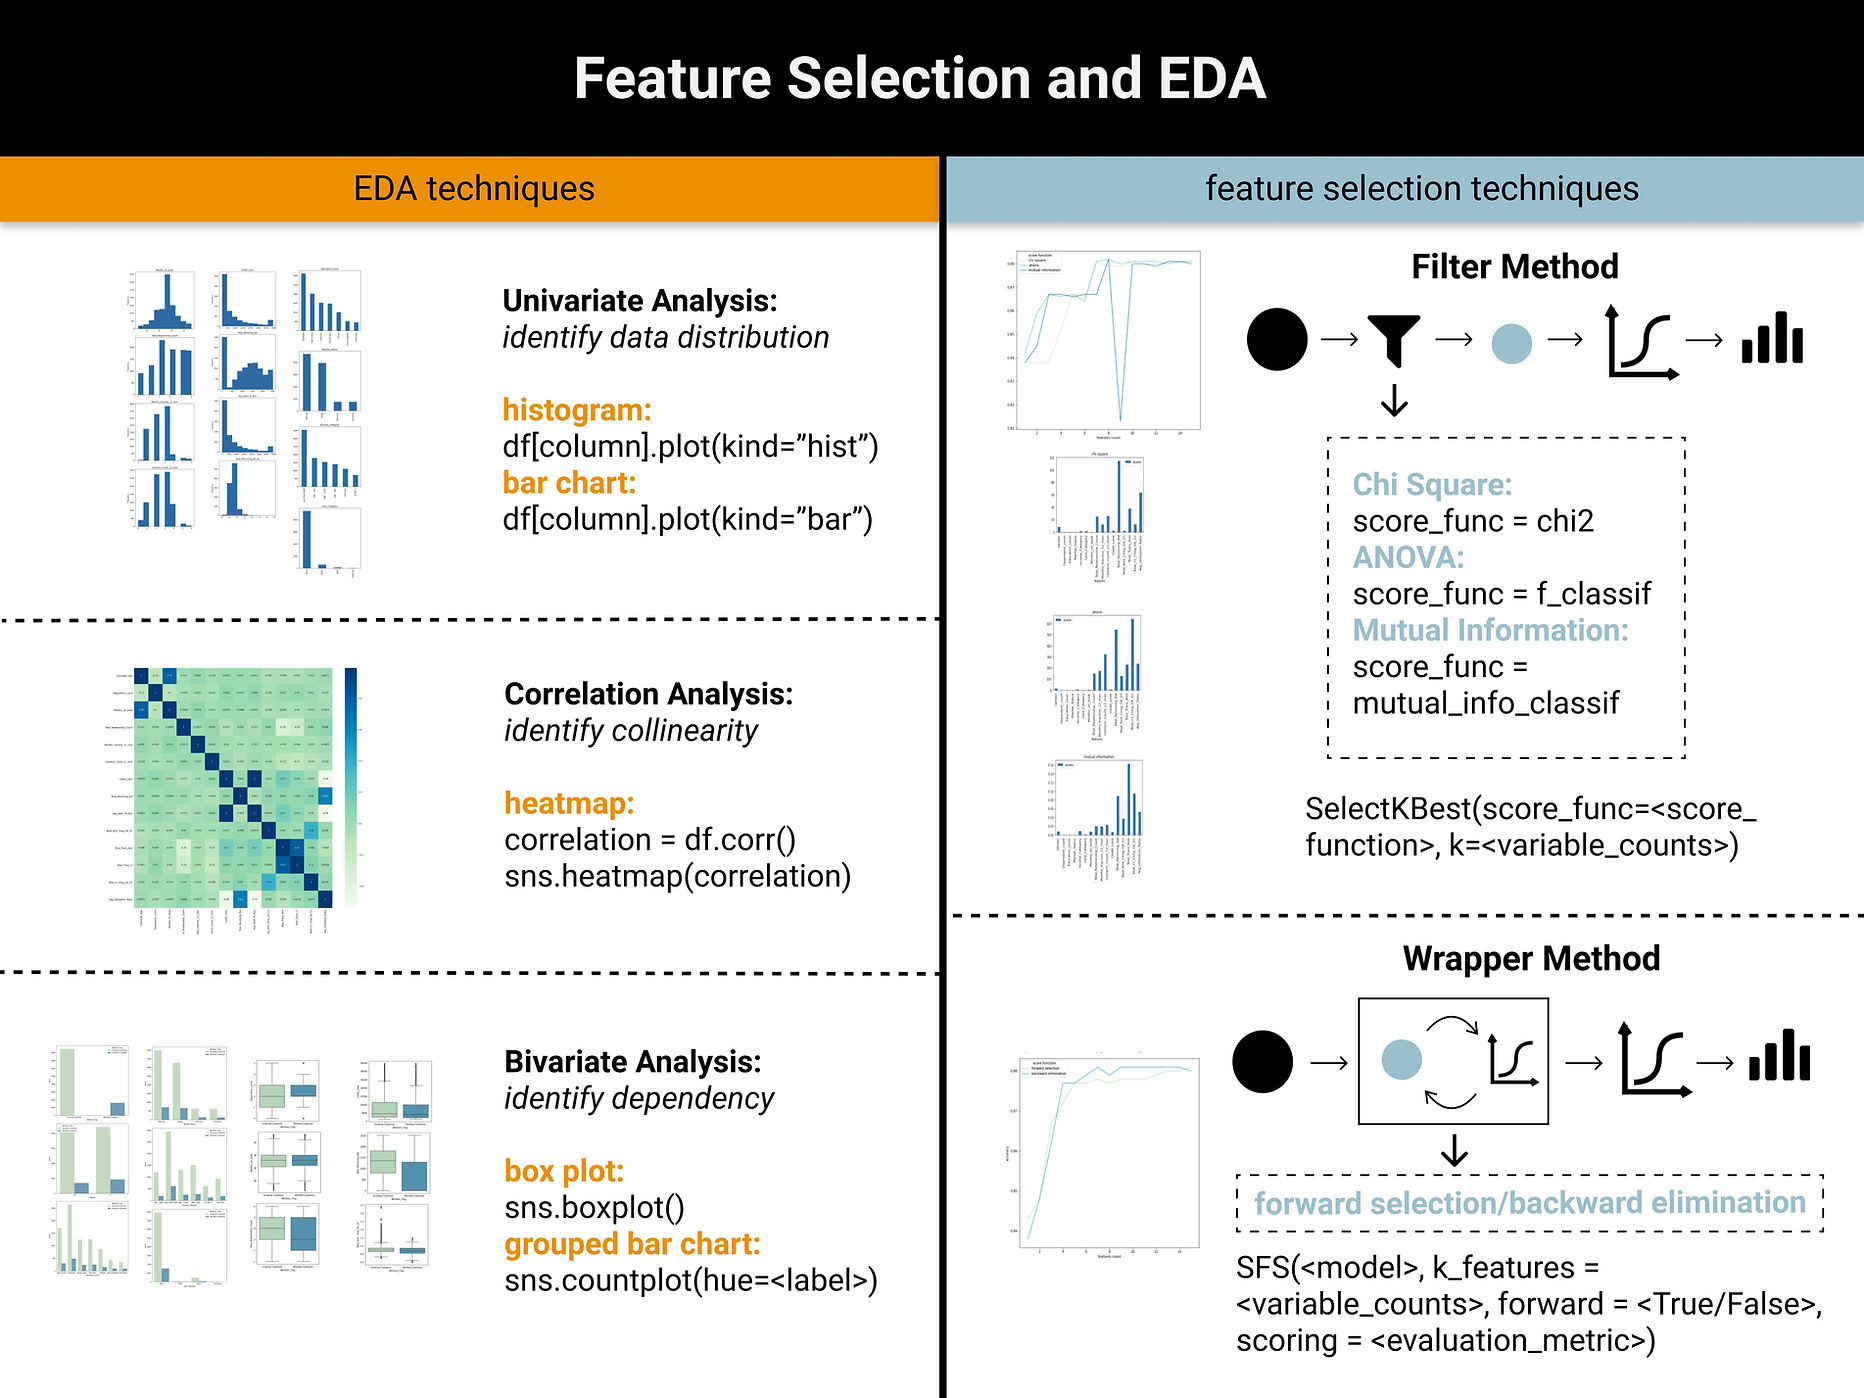
Welcome back to our feature selection series! In Part 1, we covered data preprocessing and EDA fundamentals.

Now, let’s dive into one of the most popular feature selection methods - filter method, which is primarily based on statistical tests such as Chi Square, ANOVA etc.
Implement Filter Methods

Filter methods give a score to each feature by evaluating its relationship with the dependent variable. For classification problems with categorical response variables, I am using these three major scoring functions: Chi-Square (score_func = chi2), ANOVA (score_func = f_classif), and Mutual Information (score_func = mutual_info_classif). To create a feature selection model, we need the SelectKBest() function, then specific which scoring functions to utilize and the how many variables to select.
selection_model = SelectKBest(
    score_func=score_function,
    k=variable_counts
)
I would like to know how these two parameters, scoring function and the number of variables, would affect the accuracy of the model trained on the selected features.
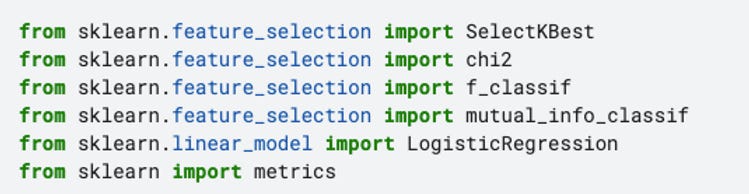
Firstly, to create the carry out the feature selection and examine the performance of the model built upon it, I define a feature_selection function with following steps:
import required libraries
create a feature selection model based on two parameters: score_function (e.g. chi square) and variable counts (e.g. ranging from 1 to all features)
train a logistic regression model based on selected features only
calculates the accuracy score
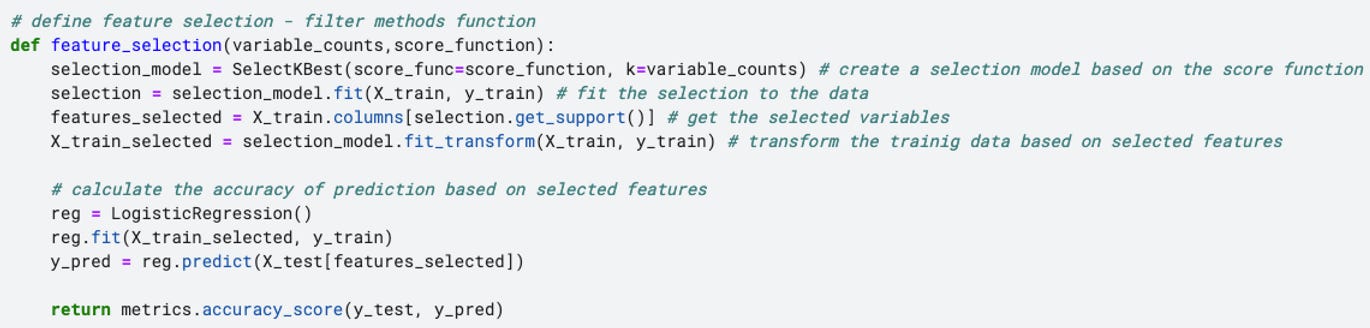
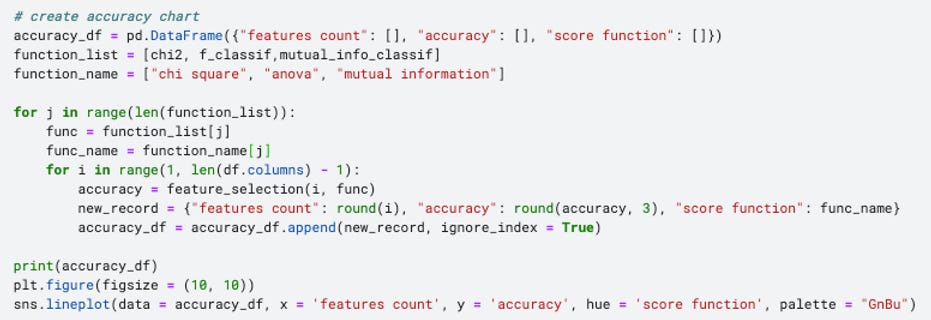
Secondly, to test how score functions and variable counts would affect the model performance, I iteratively passing different combinations of two parameters, “variable_counts” and “score_function”, using the following code.
Check out our video on Feature Selection.
Interpret Filter Methods with Data Visualization
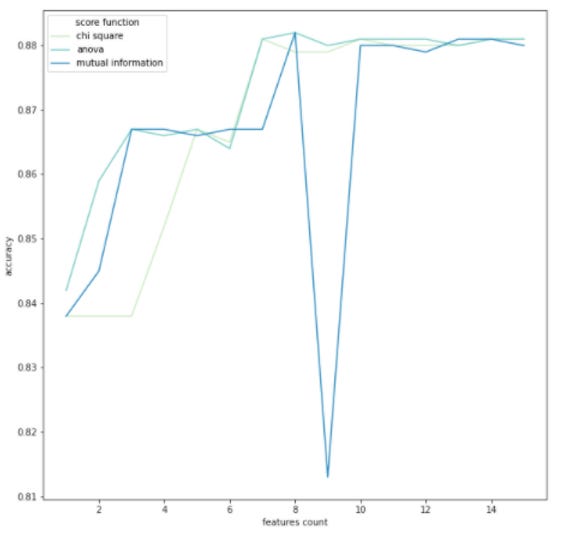
The result was generated in a data frame format and then use line chart to demonstrate how the accuracy progress as the number of selected features grows. As shown, except mutual information method, the accuracy score stabilizes around 0.88 after reaching 8 features.
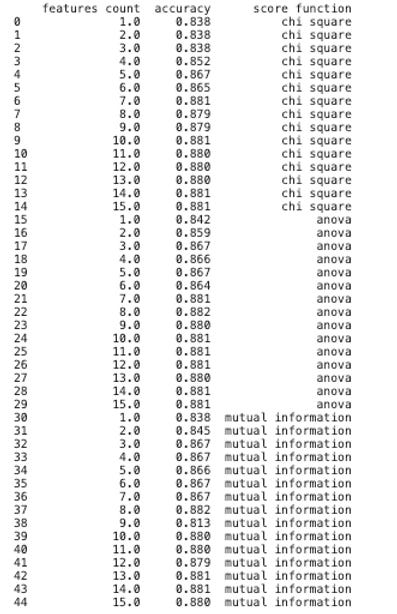
Afterwards, let’s investigate what is the score of each feature based on various approaches. This time we will use bar charts to visualize the scores has been allocated to features according to chi-square, anova or mutual information.

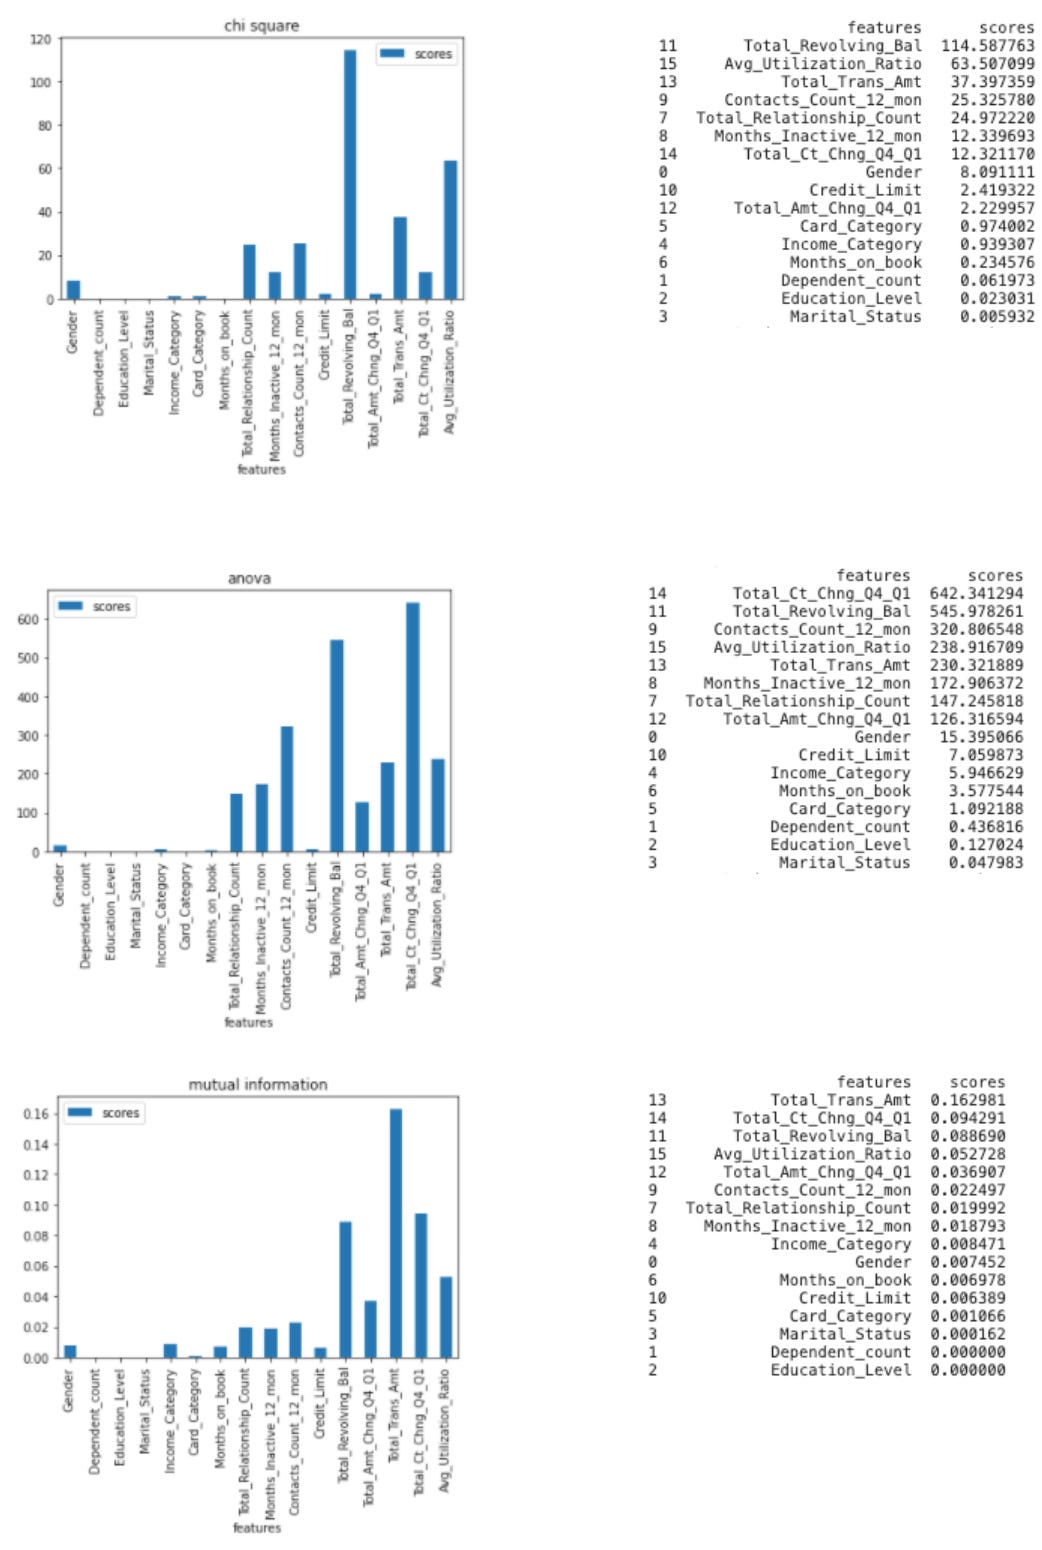
As you can see, different approach scores the same feature differently, but some features always appear higher up on the list. For example, “Total_Revolving_Bal” is always among the top 3, which is aligned with the findings from the box plot in the bivariate EDA demonstrated in our the Part 1 of this series. And “Card_Category” does have high feature importance compared to other categorical variables, which can be explained by the grouped bar chart.