
Data Science 101: Data Transformation in Machine Learning - Log Transformation & Clipping
How to Choose the Appropriate Technique Based on Your Data

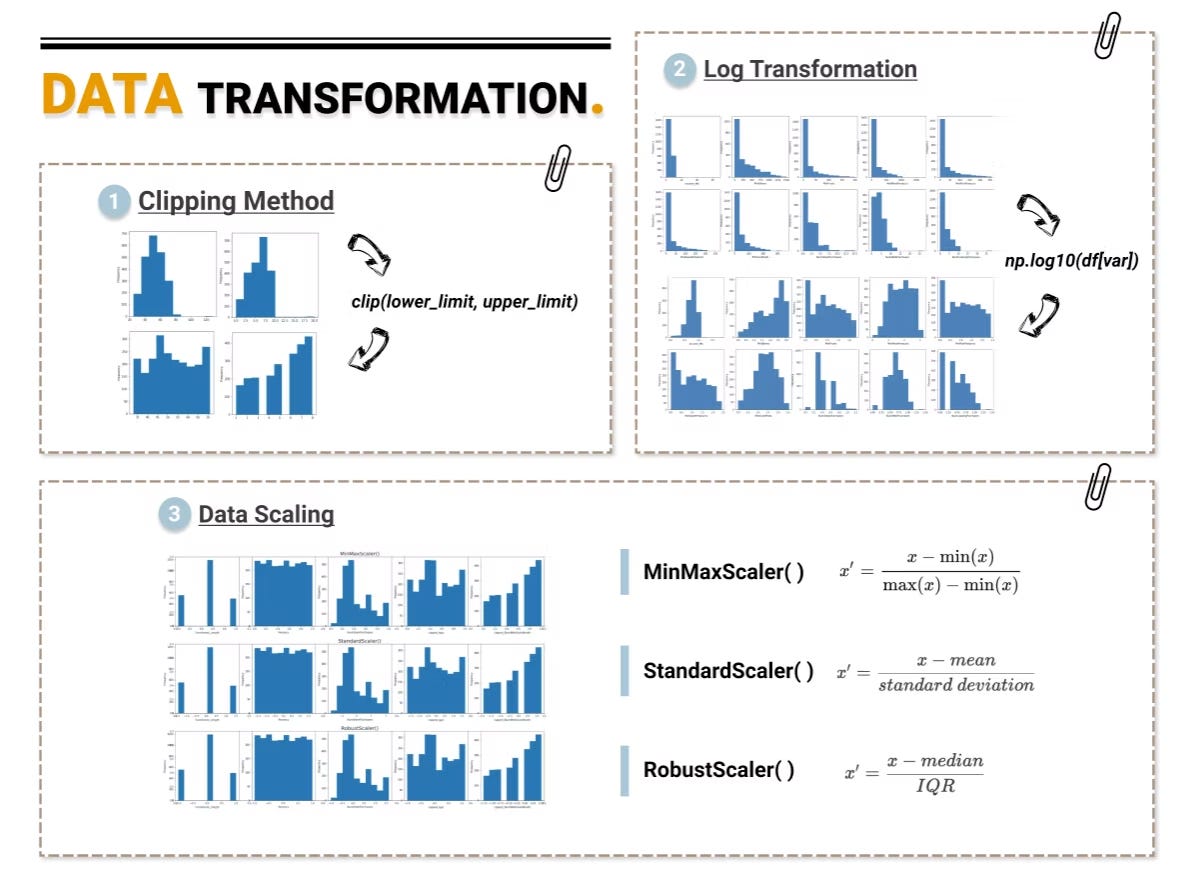
Data Transformation Definition
Data transformation converts raw data into a a format or structure that would be more suitable for the machine learning model or algorithm. It is an essential step in the feature engineering that facilitates discovering insights. This article mainly covers two techniques for numeric data transformation - Log Transformation and Clipping. In our next post, we will focus on three types of data scaling methods.
Why is data transformation important?
the algorithm is more likely to be biased when the data distribution is skewed
transforming data into the same scale allows the algorithm to compare the relative relationship between data points better
If you’d like to learn more about EDA techniques for uncovering data relationships, check out our video.
When to apply data transformation?
When implementing supervised algorithms, training data and testing data need to be transformed in the same way. This is usually achieved by feeding the training dataset to building the data transformation algorithm and then apply that algorithm to the test set.
Data Transformation Implementation
For this exercise, I am using the Marketing Analytics dataset from Kaggle. Firstly I performed some basic feature engineering to make data tidier and more insightful.
For a video guide to these concepts, please check out our YouTube channel 🎬
Basic Feature Engineering Steps
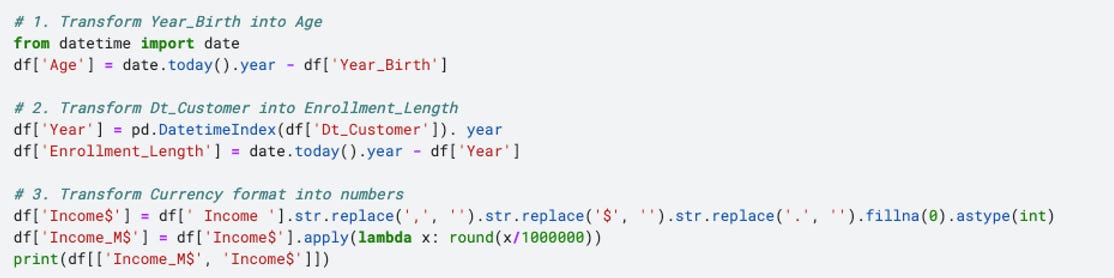
transform year of birth to “Age”
This is a basic subtraction of year of birth to the current year.transform the date customer enrolled (”Dt_Customer”) into “Enrollment_Length”
This process is similar to the one above with additionally extracting the year part from the date feature.transform currency (”Income”) into numbers (”Income_M$”)
This involves four steps: 1) clean data to remove characters “, $ .” 2) substitute null value to 0; 3) convert string into integer; 4) scale down the numbers into million dollar which helps with visualizing the data distribution
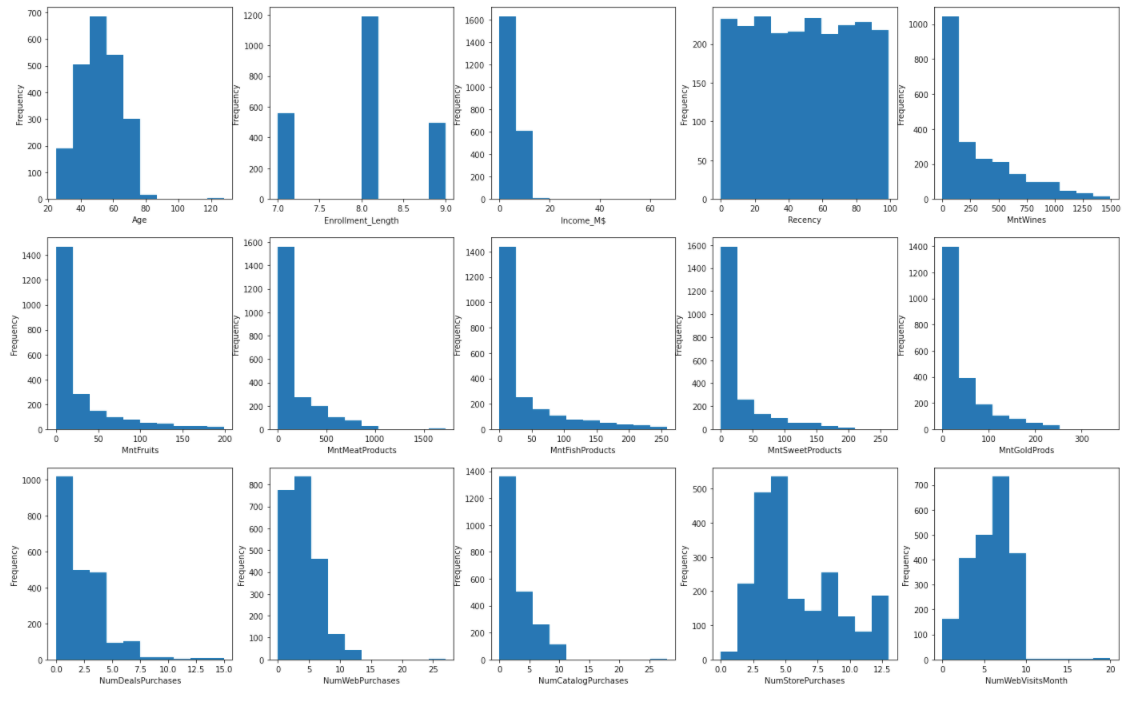
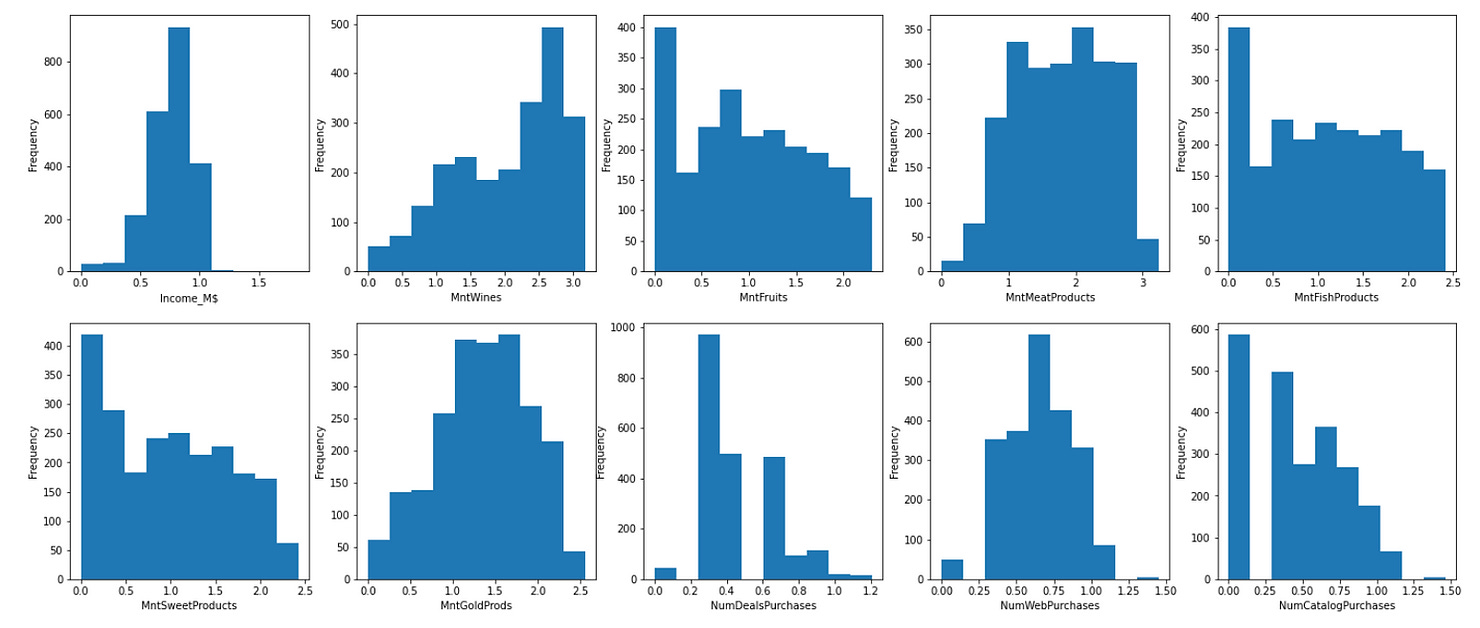
Now, let’s visualize current data distribution using a simple univariate EDA technique - histogram. It is not hard to see that most variables are heavily skewed.
If you want to know more about data visualization and exploratory data analysis (EDA), please check out:

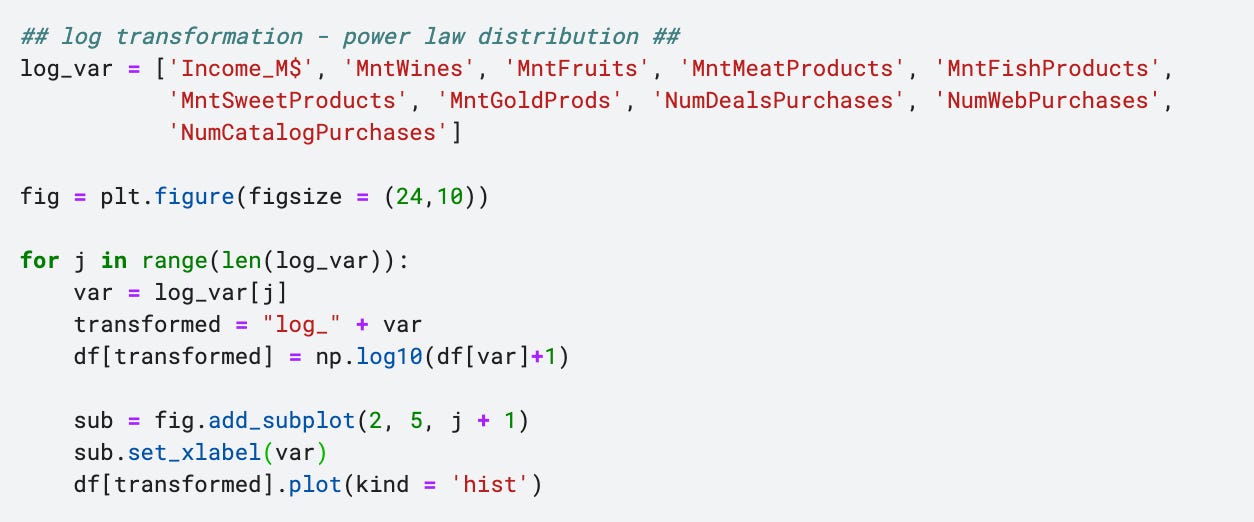
Log Transformation - for right skewed data
When the data sample follows the power law distribution, we can use log scaling to transform the right skewed distribution into normal distribution. To achieve this, simply use the np.log() function. In this dataset, most variables fall under this category.
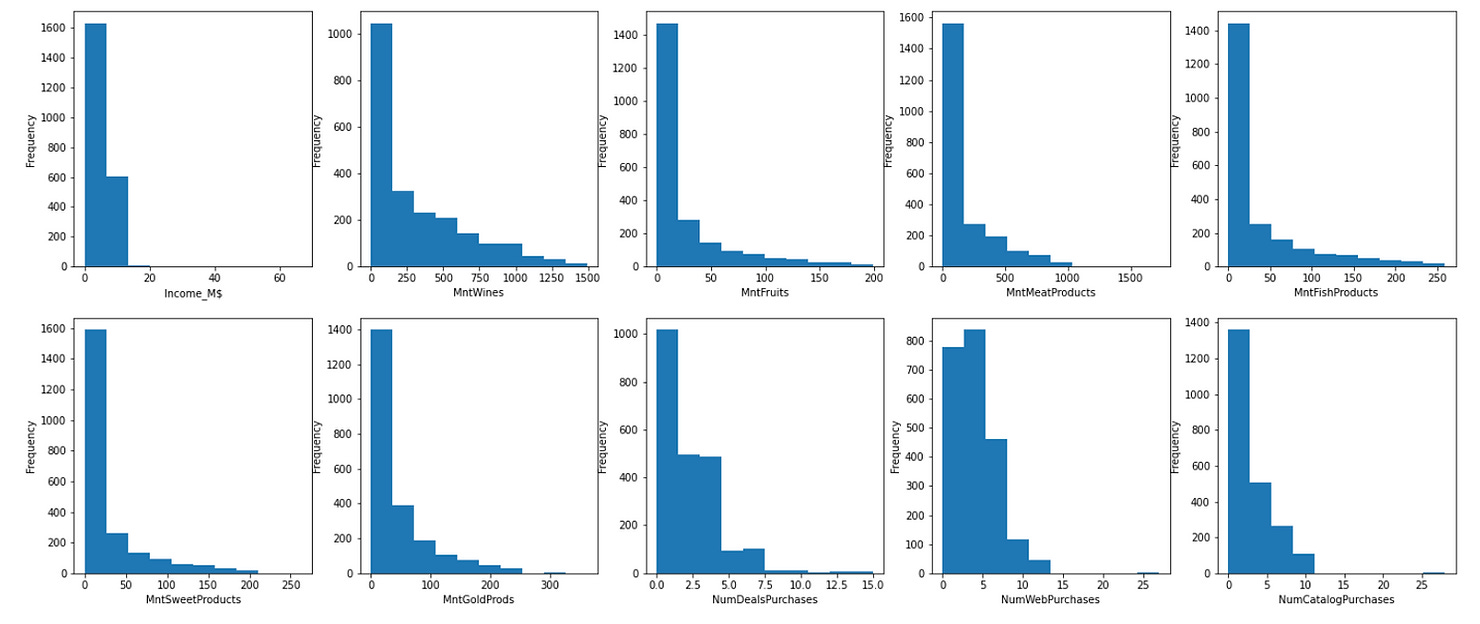
After the log transformation, these features have become more normally distributed.
Clipping - for handling outliers
This approach is more suitable when there are outliers in the dataset. Clipping method sets up the upper and lower bound and all data points will be contained within the range.
We can use quantile() to find out what is the range of the majority amount of data (between 0.05 percentile and 0.95 percentile). Any numbers below the lower bound (defined by 0.05 percentile) will be rounded up to the lower bound. Similarly, the numbers above upper bound (defined by 0.95 percentile) will be rounded down to upper bound.
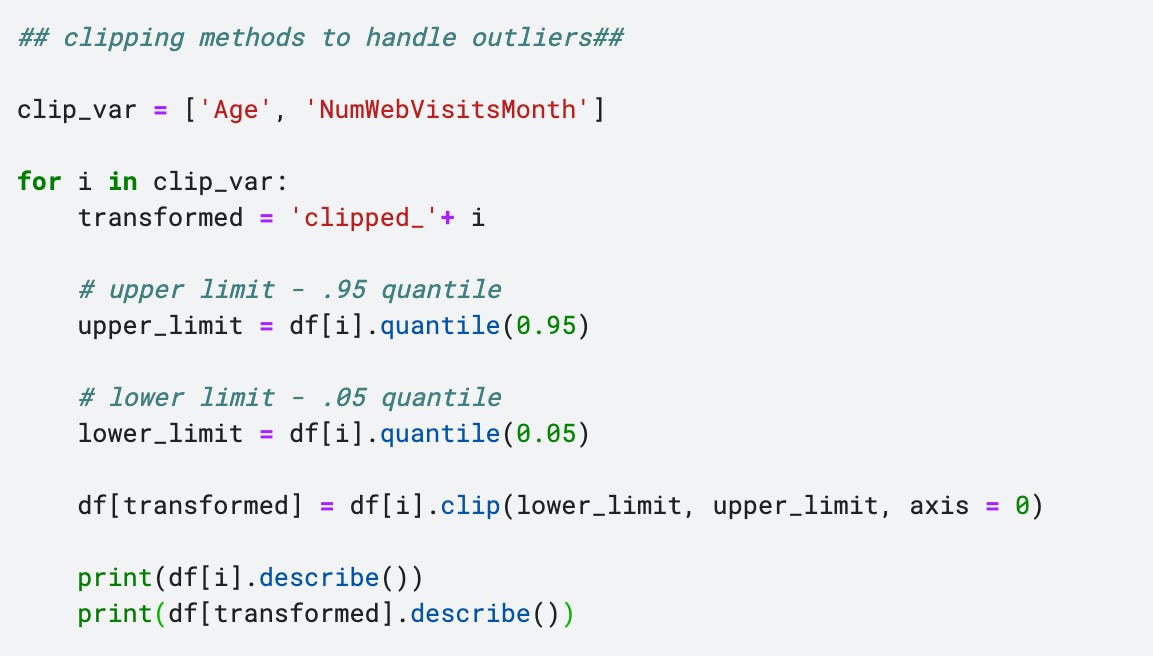
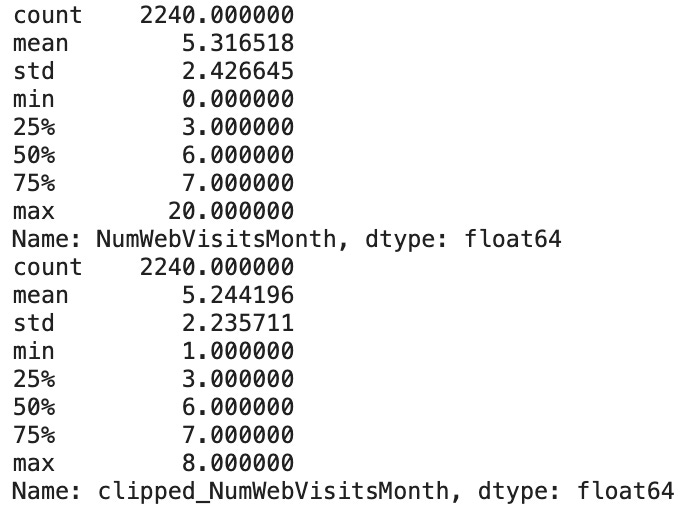
From the histogram in the EDA process, we can see that variable “Age” and “NumWebVisitsMonth” have outliers with extraordinary large numbers. So I will only apply clipping to these two columns.
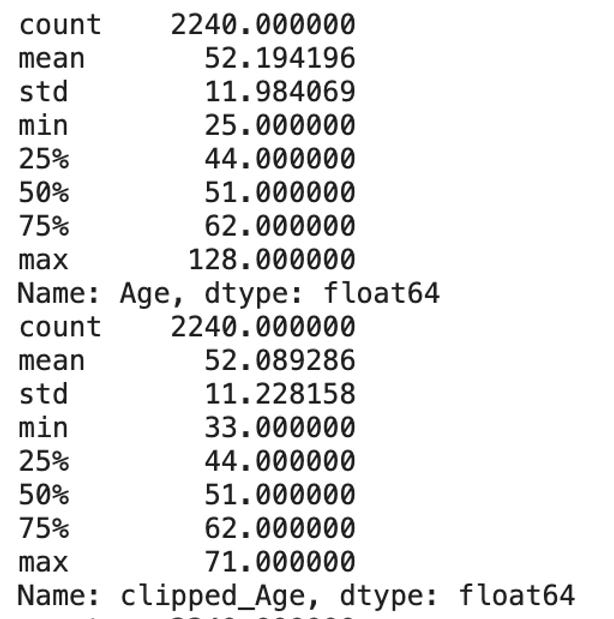
Consequently, the maximum value for both fields dropped significantly:
Age: from 128 to 71
NumWebVisitMonth: from 20 to 8
Take-Home Message
This article takes you through the journey of transforming data and demonstrates how to choose the appropriate technique according to the data properties. We have focused on reshaping each feature so that its distribution better reflects the underlying customer behaviour, using log transformation for heavy right skew and clipping to handle outliers. In the next part, we will take these transformed features and place them onto a common scale using several popular scaling techniques from scikit-learn.
This piece truely made me think about the nuances of data preparation. You articulated so well why skewed data can be problematic for models. I wonder, do you think there are cases where the choice of transformation feels more art than science? Eager for the next post on scaling methods!
Thanks for sharing your experience. The scaling methods post is in the works now, so your comment is perfect motivation to ship it soon.