
Data Science 101: Data Transformation in Machine Learning - Data Scaling
Min-Max Scaler, Standard Scaler and Robust Scaler.
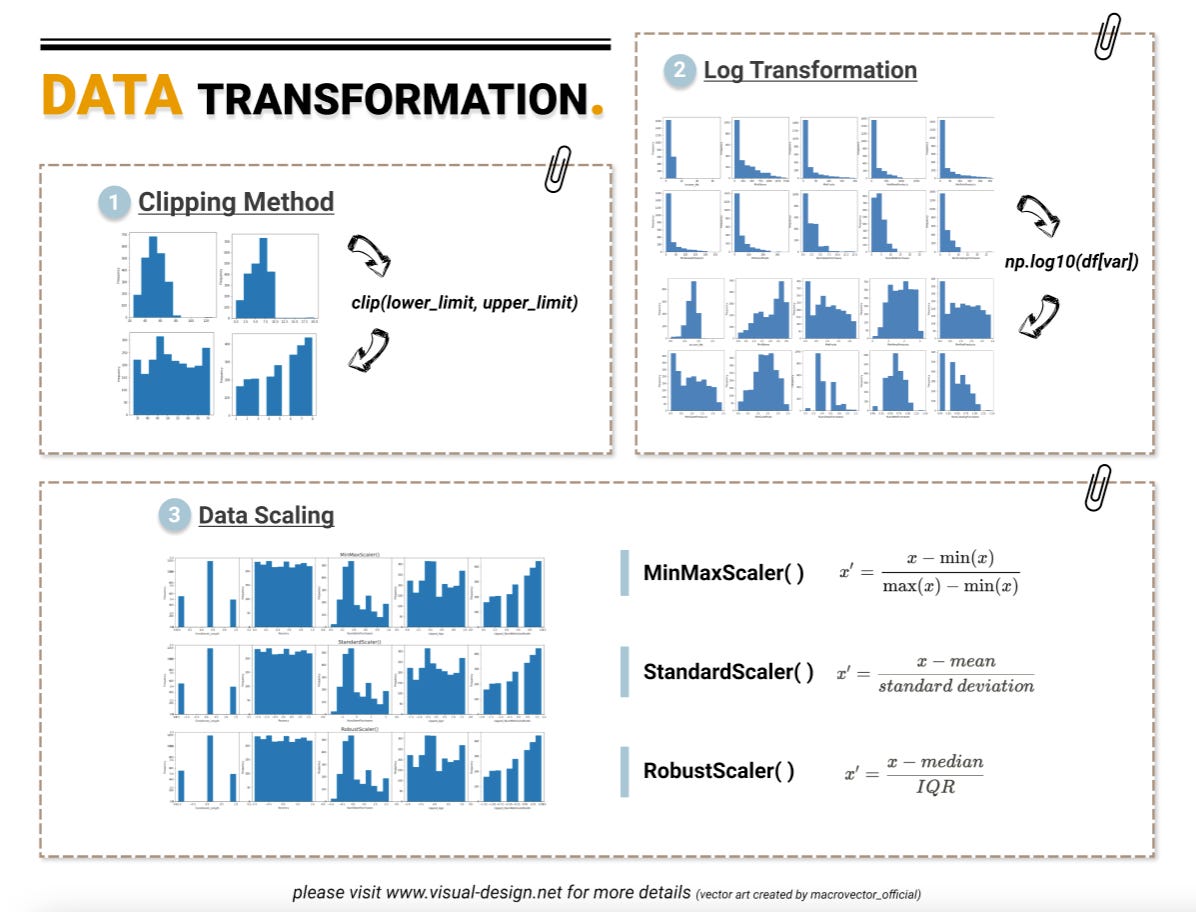
What is Data Scaling?
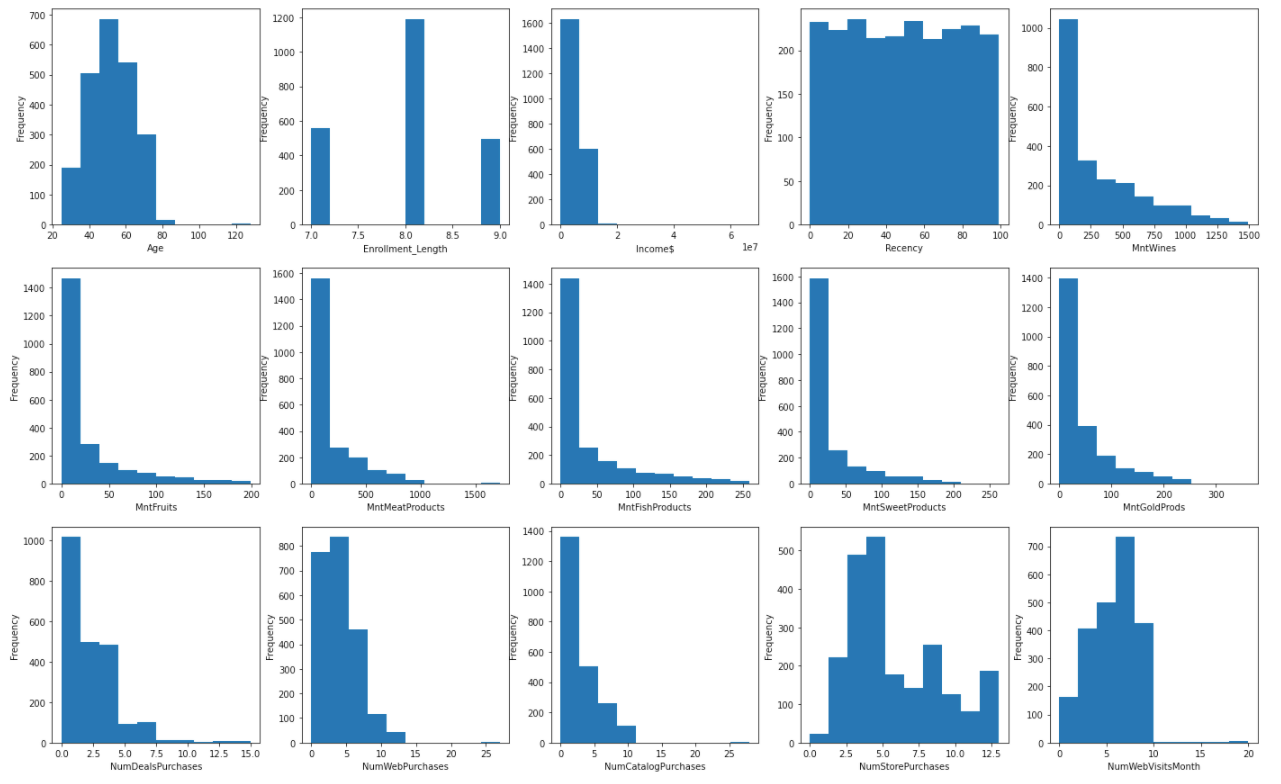
In part 1 of this series, we reshaped our numeric features using log transformation and clipping method, so that their distributions were less skewed and less affected by extreme values.

The next step is to standardize their scales so algorithms can focus on the relationships in the data on the same dimension. In this article, we will use the scikit-learn preprocessing library to compare three common approaches: min-max scaling, standardization, and robust scaling.
Min Max Scaler - normalization
MinMaxScaler() is applied when the dataset is not distorted. It normalizes the data into a range between 0 and 1 based on the formula:
x’ = (x - min(x)) / (max(x) - min(x))
Standard Scaler - standardization
We use standardization when the dataset conforms to normal distribution. StandardScaler() converts the numbers into the standard form of mean = 0 and variance = 1 based on z-score formula:
x’ = (x – mean) / standard deviation.
Robust Scaling
RobustScaler() is more suitable for dataset with skewed distributions and outliers because it transforms the data based on median and quantile, specifically
x’ = (x – median) / inter-quartile range.
Check out our video on Python EDA to understand how to use data visualization techniques to understand the data distribution.
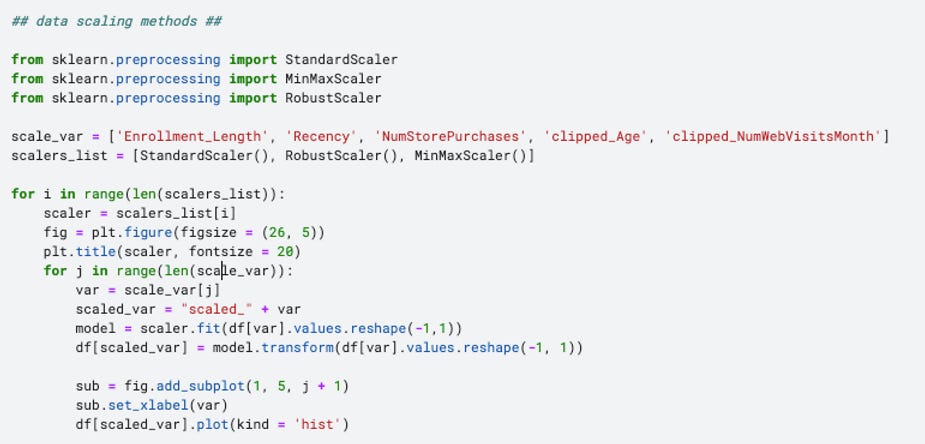
How to Implement Data Scaling?
To compare how these three scalers work, I use an iteration to scale the remaining variables (including two variables after clipping transformation) based on StandardScaler(), RobustScaler(), MinMaxScaler() respectively.
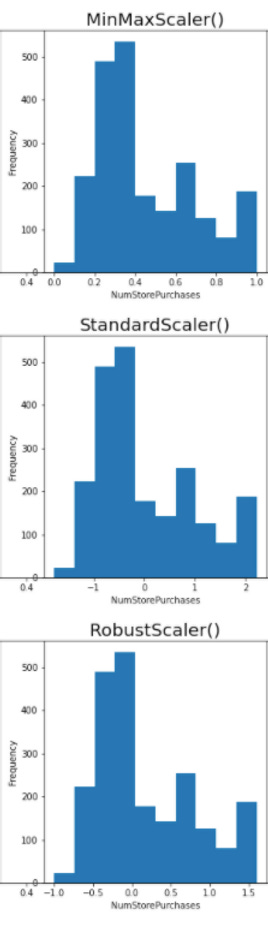
As shown, the scalers don’t change the shape of the data distribution but instead changing the spread of data point.
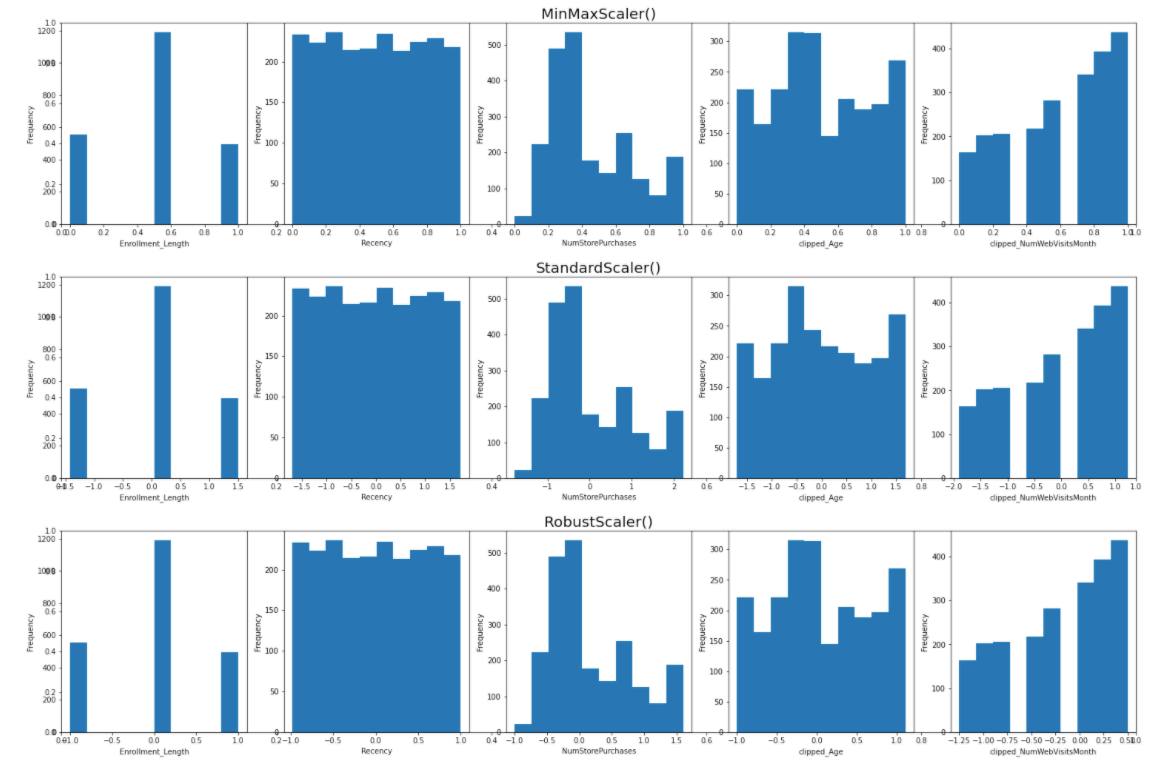
Take “NumStorePurchases” as an example, minmax scaler converts the values to be strictly between 0 and 1, standard scaler transform dataset into mean = 0 whereas robust scaler transform dataset into median = 0.
In this dataset, these five variables are neither distorted nor normally distributed, therefore using a minmax scaler should suffice.
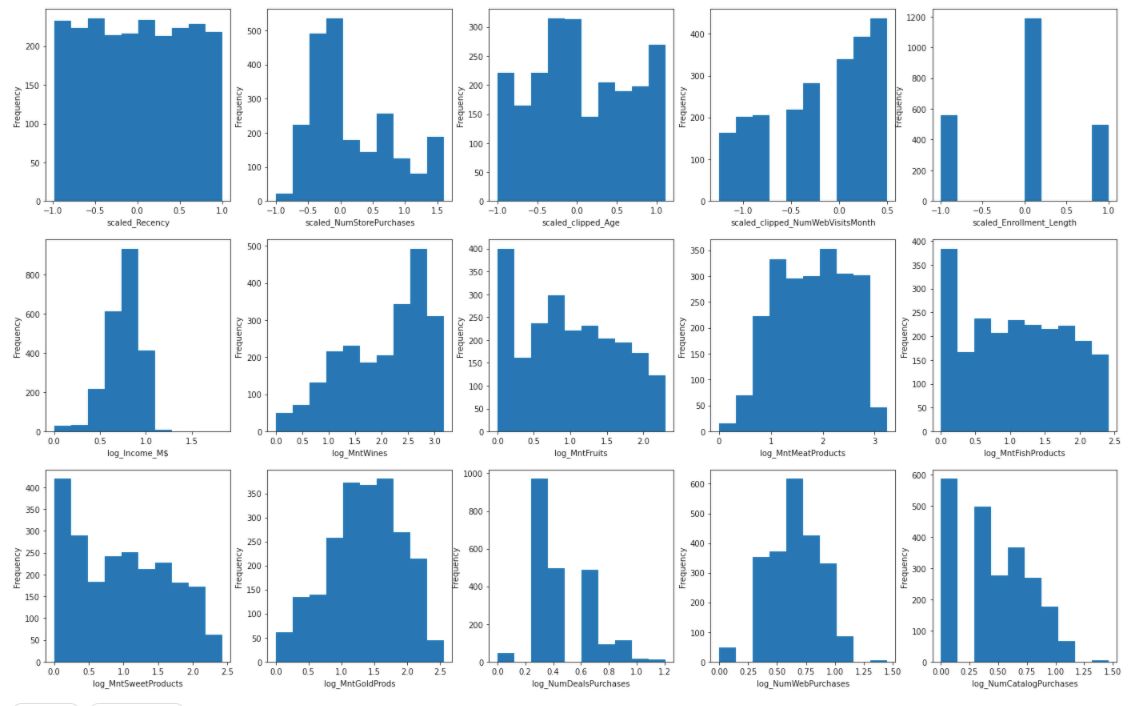
Now that all features have been transformed into according to their properties. Let’s visualize them again. We can see that the data looks more organized and less distorted, hence more suitable for model building and generating insights.
before transformation
after transformation
Take-Home Message
This series takes you through the journey of transforming data and demonstrates how to choose the appropriate technique according to the data properties.
In summary:
data cleaning: converting data type and removing unnecessary characters
log transformation for right skewed data
clipping methods for handling outliers
data scaling: minmax scaler, standard scaler, robust scaler
