
Hypothesis Testing in Python (Part 2): ANOVA & Chi-Squared Tests Explained with Code and Examples
A step-by-step guide to ANOVA and Chi-Squared with code and examples

This is Part 2 of our series on hypothesis testing in Python. In Part 1, we covered the fundamentals: the 4-step framework of hypothesis testing, and how to implement t-test using a practical example.

In this article, we continue with the practical example using Kaggle dataset “Customer Personality Analysis”, with the focus on another two hypothesis testing techniques: ANOVA test and Chi-Squared test.
How to Implement ANOVA Test in Python?
Previously, we’ve seen that the t-test helps compare the mean of one or two groups. But what if we need to compare more than two groups? In that case, we turn to the ANOVA test.
ANOVA examines the difference among groups by calculating the ratio of variance across different groups vs variance within a group. Larger ratio indicates that the difference across groups is a result of the group difference rather than just random chance.
As an example, I use the feature “Kidhome” for the prediction of “NumWebPurchases”. There are three values of “Kidhome” - 0, 1, 2 which naturally forms three groups.
kidhome_0 = sampled_df[sampled_df[’Kidhome’]==0][’NumWebPurchases’]
kidhome_1 = sampled_df[sampled_df[’Kidhome’]==1][’NumWebPurchases’]
kidhome_2 = sampled_df[sampled_df[’Kidhome’]==2][’NumWebPurchases’]
Firstly, visualize the data. I found box plot to be the most aligned visual representation of ANOVA test.

It appears there are clear differences among the three groups, so we’ll perform an ANOVA test to check whether these differences are statistically significant.
1. define hypothesis:
null hypothesis: there is no difference among three groups
alternative hypothesis: there is difference between at least two groups
2. choose the appropriate test: ANOVA test is suitable for examining the relationships of numeric values against a categorical value with more than two groups. Similar to t-test (discussed in Part 1), the null hypothesis of ANOVA test also follows a distribution defined by degrees of freedom. The degrees of freedom in ANOVA is determined by number of total samples (n) and the number of groups (k).
dfn = n - 1
dfd = n - k
from scipy.stats import f

dfn = 3-1
dfd = 100-3
rv = f(dfn, dfd)
3. calculate the p-value: To calculate the p-value of the f-statistics, we use the right tail cumulative area of the f-distribution, which is 1 - rv.cdf(x).
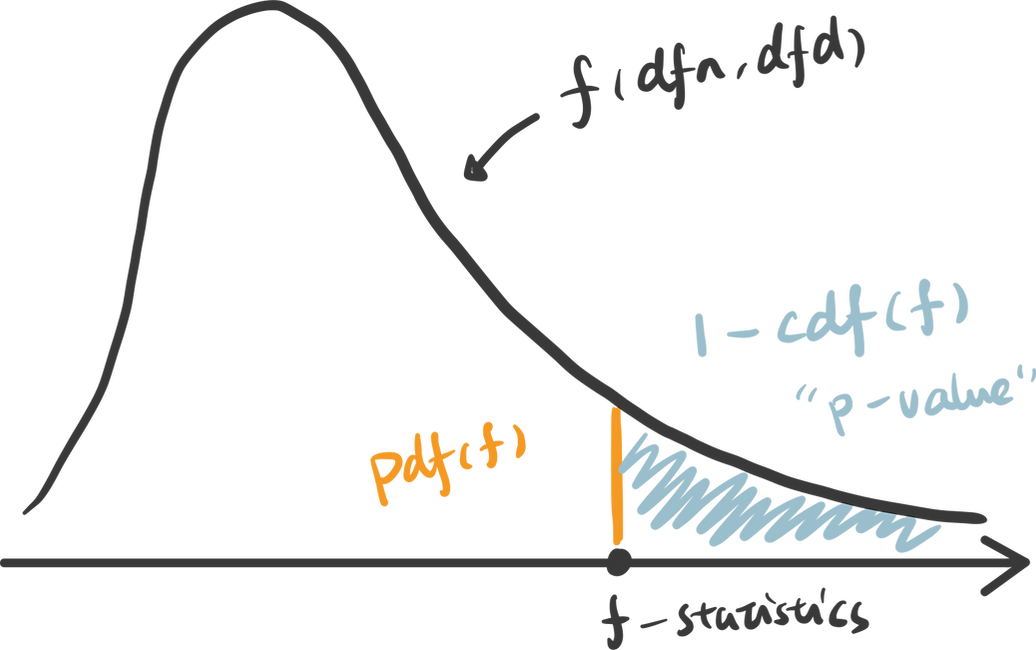
x = np.linspace(rv.ppf(0.0001), rv.ppf(0.9999), 100000)
y = rv.pdf(x)
pvalue = 1 - rv.cdf(x)
To easily get the f-statistics and p-value using Python, we can use the function stats.f_oneway() which returns p-value: 0.00040.
f_stat, pvalue = stats.f_oneway(kidhome_0, kidhome_1, kidhome_2)4. determine the statistical significance: Compare the p-value against the significance level 0.05, we can infer that there is strong evidence against the null hypothesis and very likely that there is difference in “NumWebPurchases” between at least two groups.
For a video guide to these concepts, please check out our YouTube channel 🎬:
How to Implement Chi-Squared Test in Python?
Chi-Squared test is appropriate for testing the relationship between two categorical variables. The underlying principle is that if two categorical variables are independent, then one categorical variable should have similar composition when the other categorical variable change. Let’s look at the example of whether “Education” and “Response” are independent.
Firstly, use stacked bar chart and contingency table to summary the count of each category.
ed_contingency = pd.crosstab(sampled_df[’Education’], sampled_df[’Response’])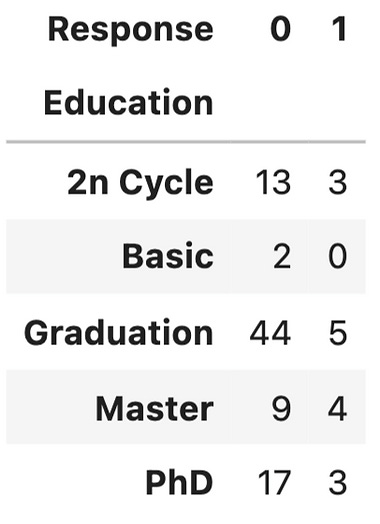

If these two variables are completely independent to each other (null hypothesis is true), then the proportion of positive Response and negative Response should be the same across all Education groups. It seems like composition are slightly different, but is it significant enough to say there is dependency - let’s run a Chi-Squared test.
1. define hypothesis:
null hypothesis: “Education” and “Response” are independent to each other.
alternative hypothesis: “Education” and “Response” are dependent to each other.
2. choose the appropriate test: Chi-Squared test is chosen and you probably found a pattern here, that Chi-distribution is also determined by the degree of freedom which is (row - 1) x (column - 1).
from scipy.stats import chi2
r = 5
c = 2
dof = (5-1) * (2-1)
rv = chi2(df= dof)
3. calculate the p-value: p value is calculated as the right tail cumulative area: 1 - rv.cdf(x).
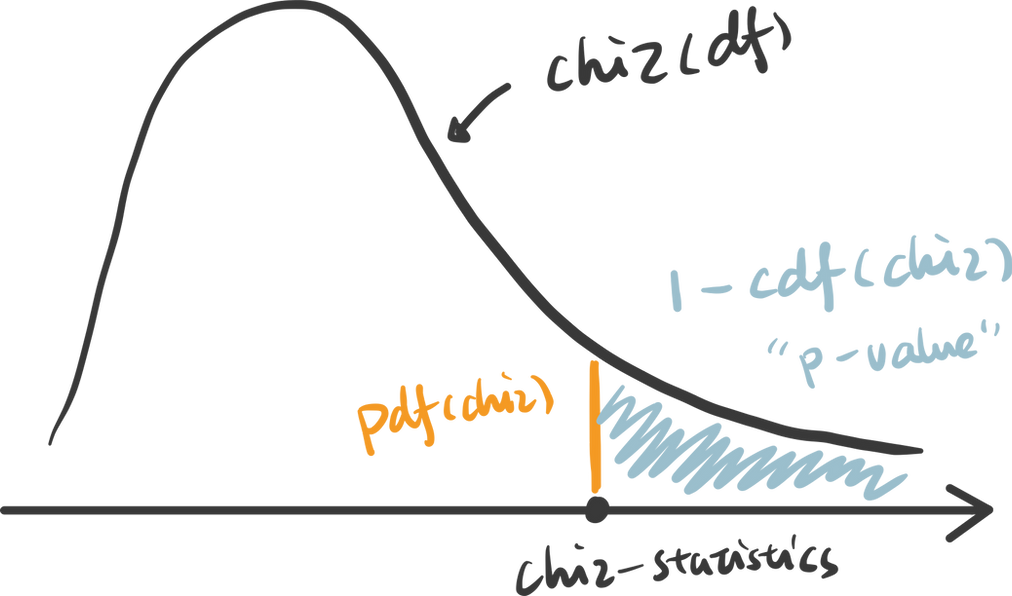
x = np.linspace(rv.ppf(0.0001), rv.ppf(0.9999), 100000)
y = rv.pdf(x)
pvalue = 1 - rv.cdf(x)
Python also provides a useful function to get the chi statistics and p-value given the contingency table.
chi2_stat, pvalue, dof, exp = chi2_contingency(ed_contingency)4. determine the statistical significance: the p-value here is 0.41, suggesting that it is not statistically significant. Therefore, we cannot reject the null hypothesis that these two categorical variables are independent. This further indicates that “Education” may not be a strong predictor of “Response”.
Thanks for reaching so far, we have covered a lot of content in this article but still have two important hypothesis tests that are worth discussing separately in upcoming posts.
z-test: test the difference between two categories of numeric variables - when sample size is LARGE
correlation: test the relationship between two numeric variables
Please leave a comment on this post to let me know which topics you’d like me to cover next.
Thanks for reaching so far! This post is public so feel free to share it.
Take Home Message
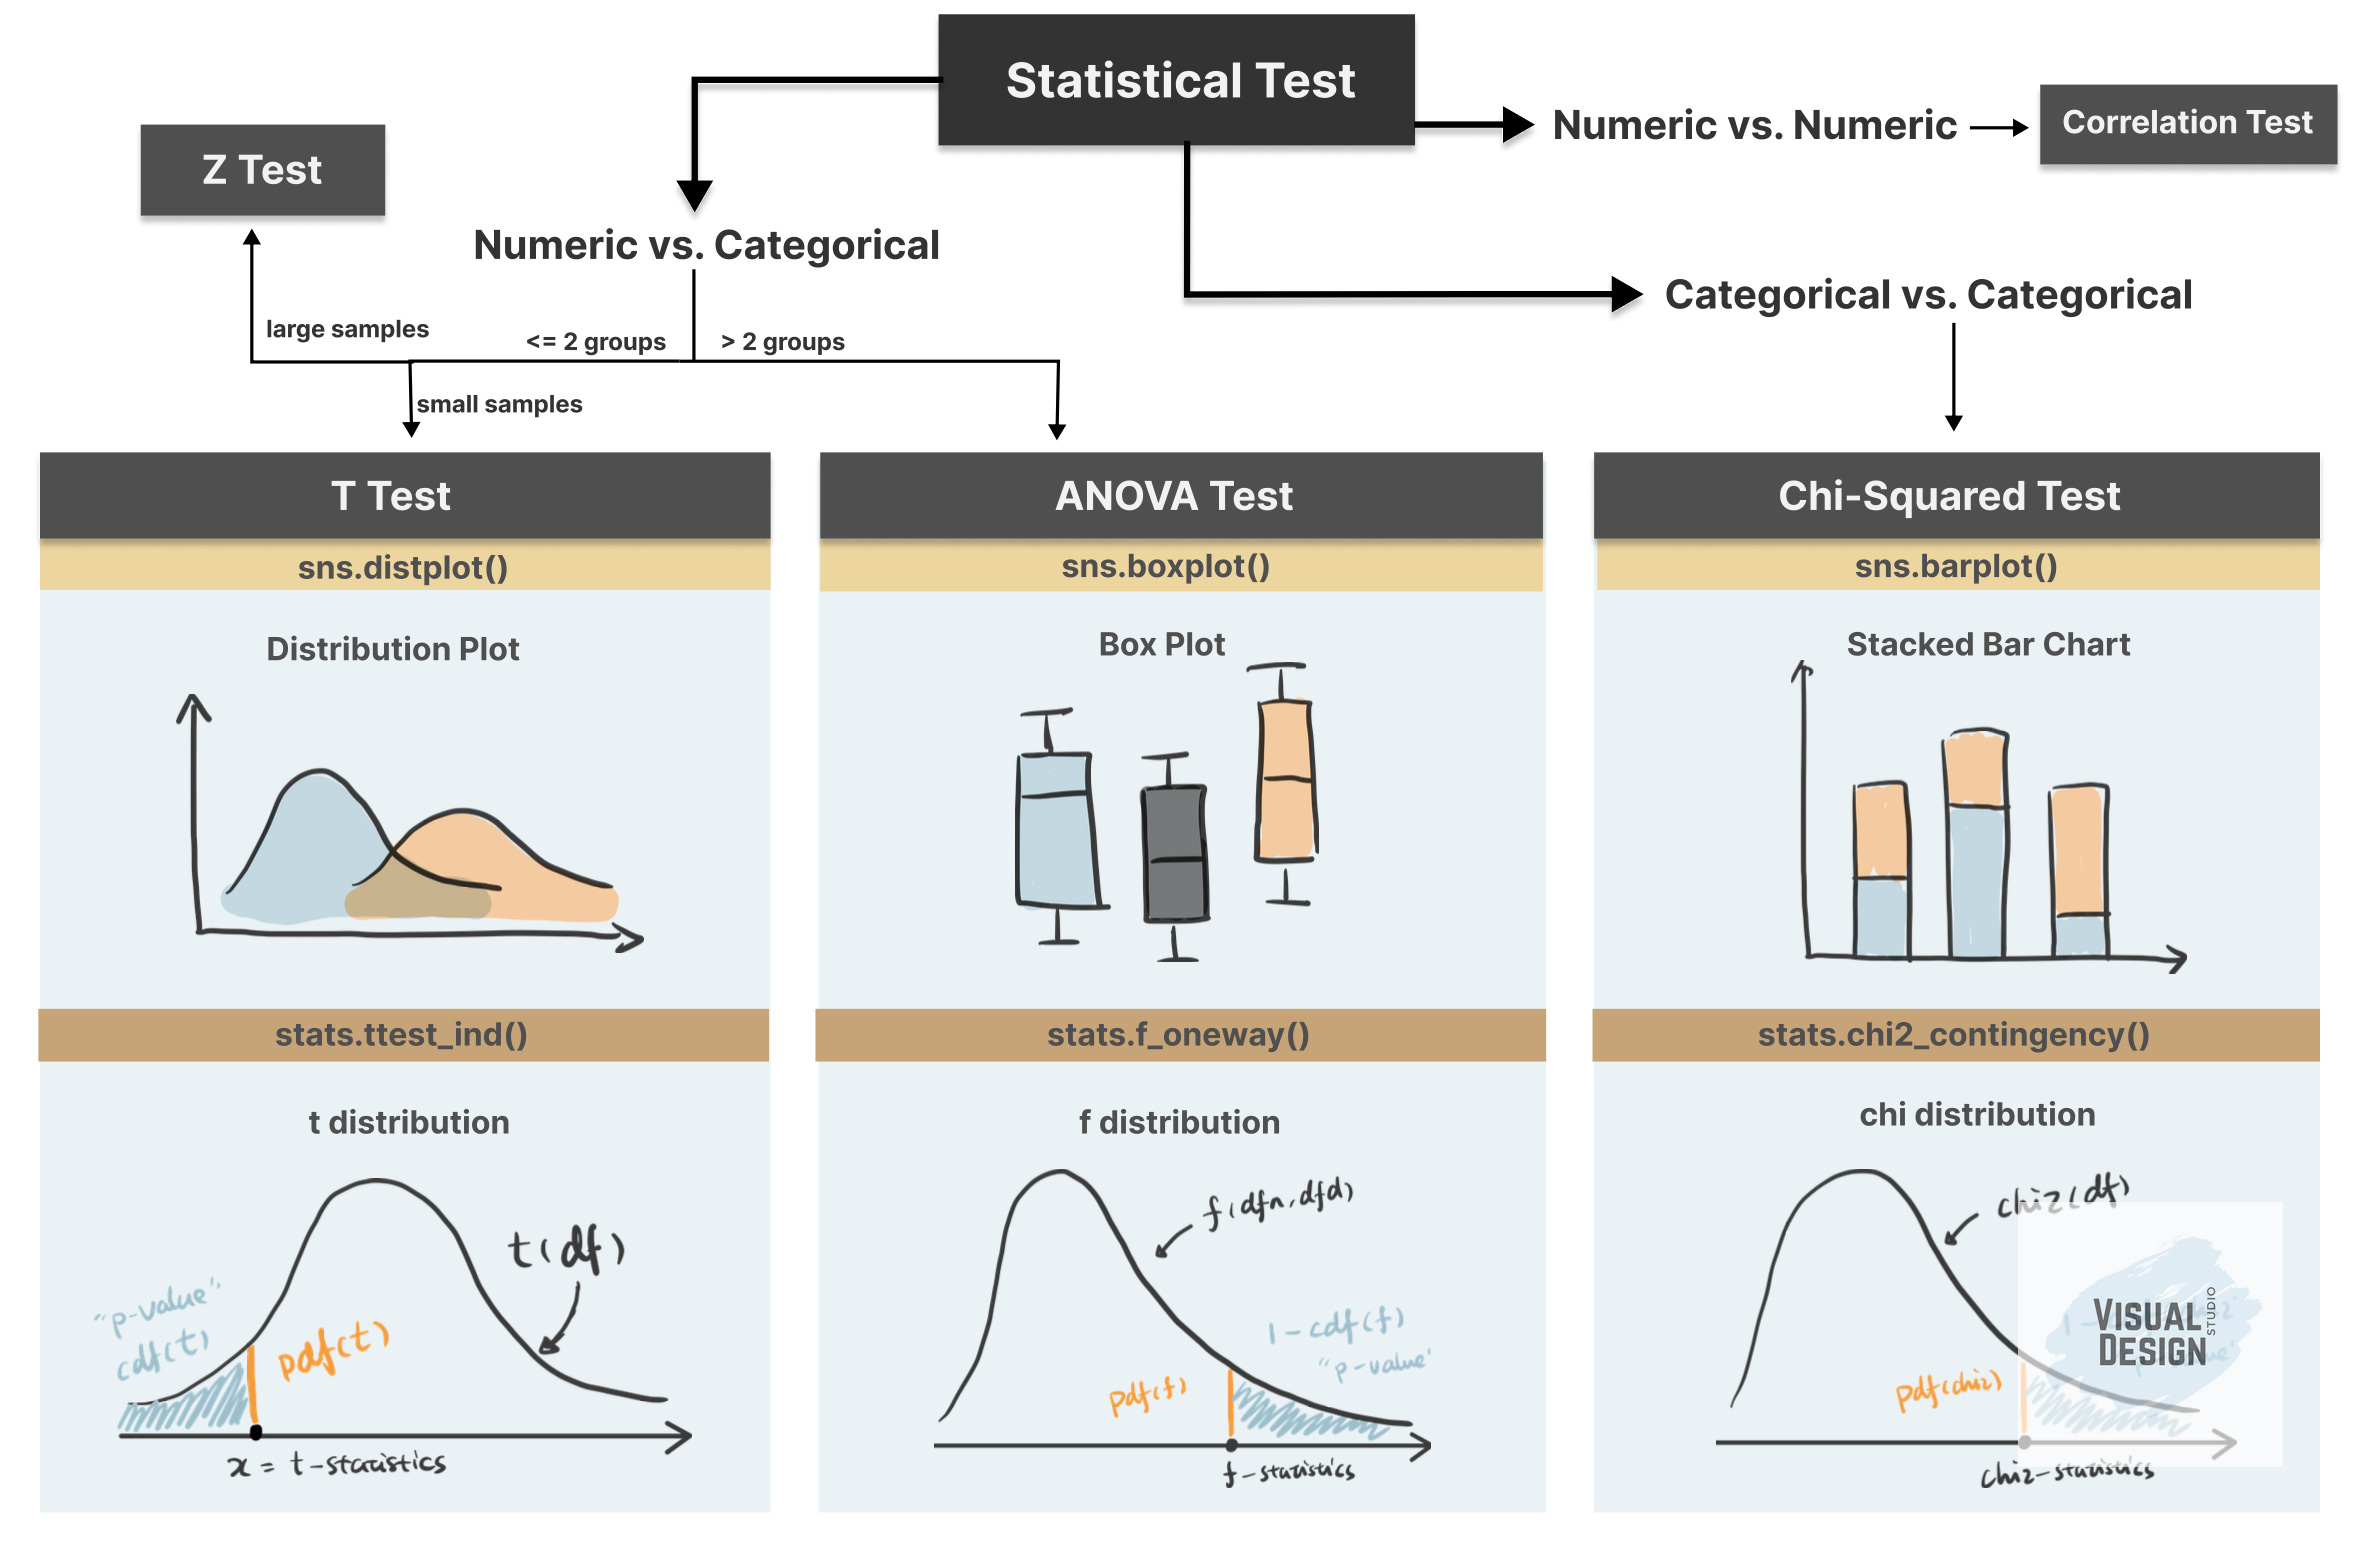
In this article, we interactively explore and visualize the difference between three common statistical tests: T-test, ANOVA test and Chi-Squared test. We also use examples to walk through essential steps in hypothesis testing:
1. define the null and alternative hypothesis
2. choose the appropriate test
3. calculate the p-value
4. determine the statistical significance
