
Hypothesis Testing in Python (Part 1): T-Tests Explained with Code and Examples
A step-by-step guide to p-values, null hypotheses, alternative hypotheses, and statistical significance

Hypothesis testing is an essential part in inferential statistics where we use observed data in a sample to draw conclusions about unobserved data - often the population.
Implication of hypothesis testing:
clinical research: widely used in psychology, biology and healthcare research to examine the effectiveness of clinical trials
A/B testing: can be applied in business context to improve conversion rate through testing different versions of campaign incentives, website designs ...
feature selection in machine learning: filter-based feature selection methods use different statistical tests to determine the feature importance. You can find out more in this article:

Hypothesis Testing Step-by-Step
Step 1. Define null and alternative hypothesis
Null hypothesis (H0) can be stated differently depends on the statistical tests, but generalize to the claim that no difference, no relationship or no dependency exists between two or more variables.
Alternative hypothesis (H1) is contradictory to the null hypothesis and it claims that relationships exist. It is the hypothesis that we would like to prove right. However, a more conservational approach is favored in statistics where we always assume null hypothesis is true and try to find evidence to reject the null hypothesis.
Step 2. Choose the appropriate test
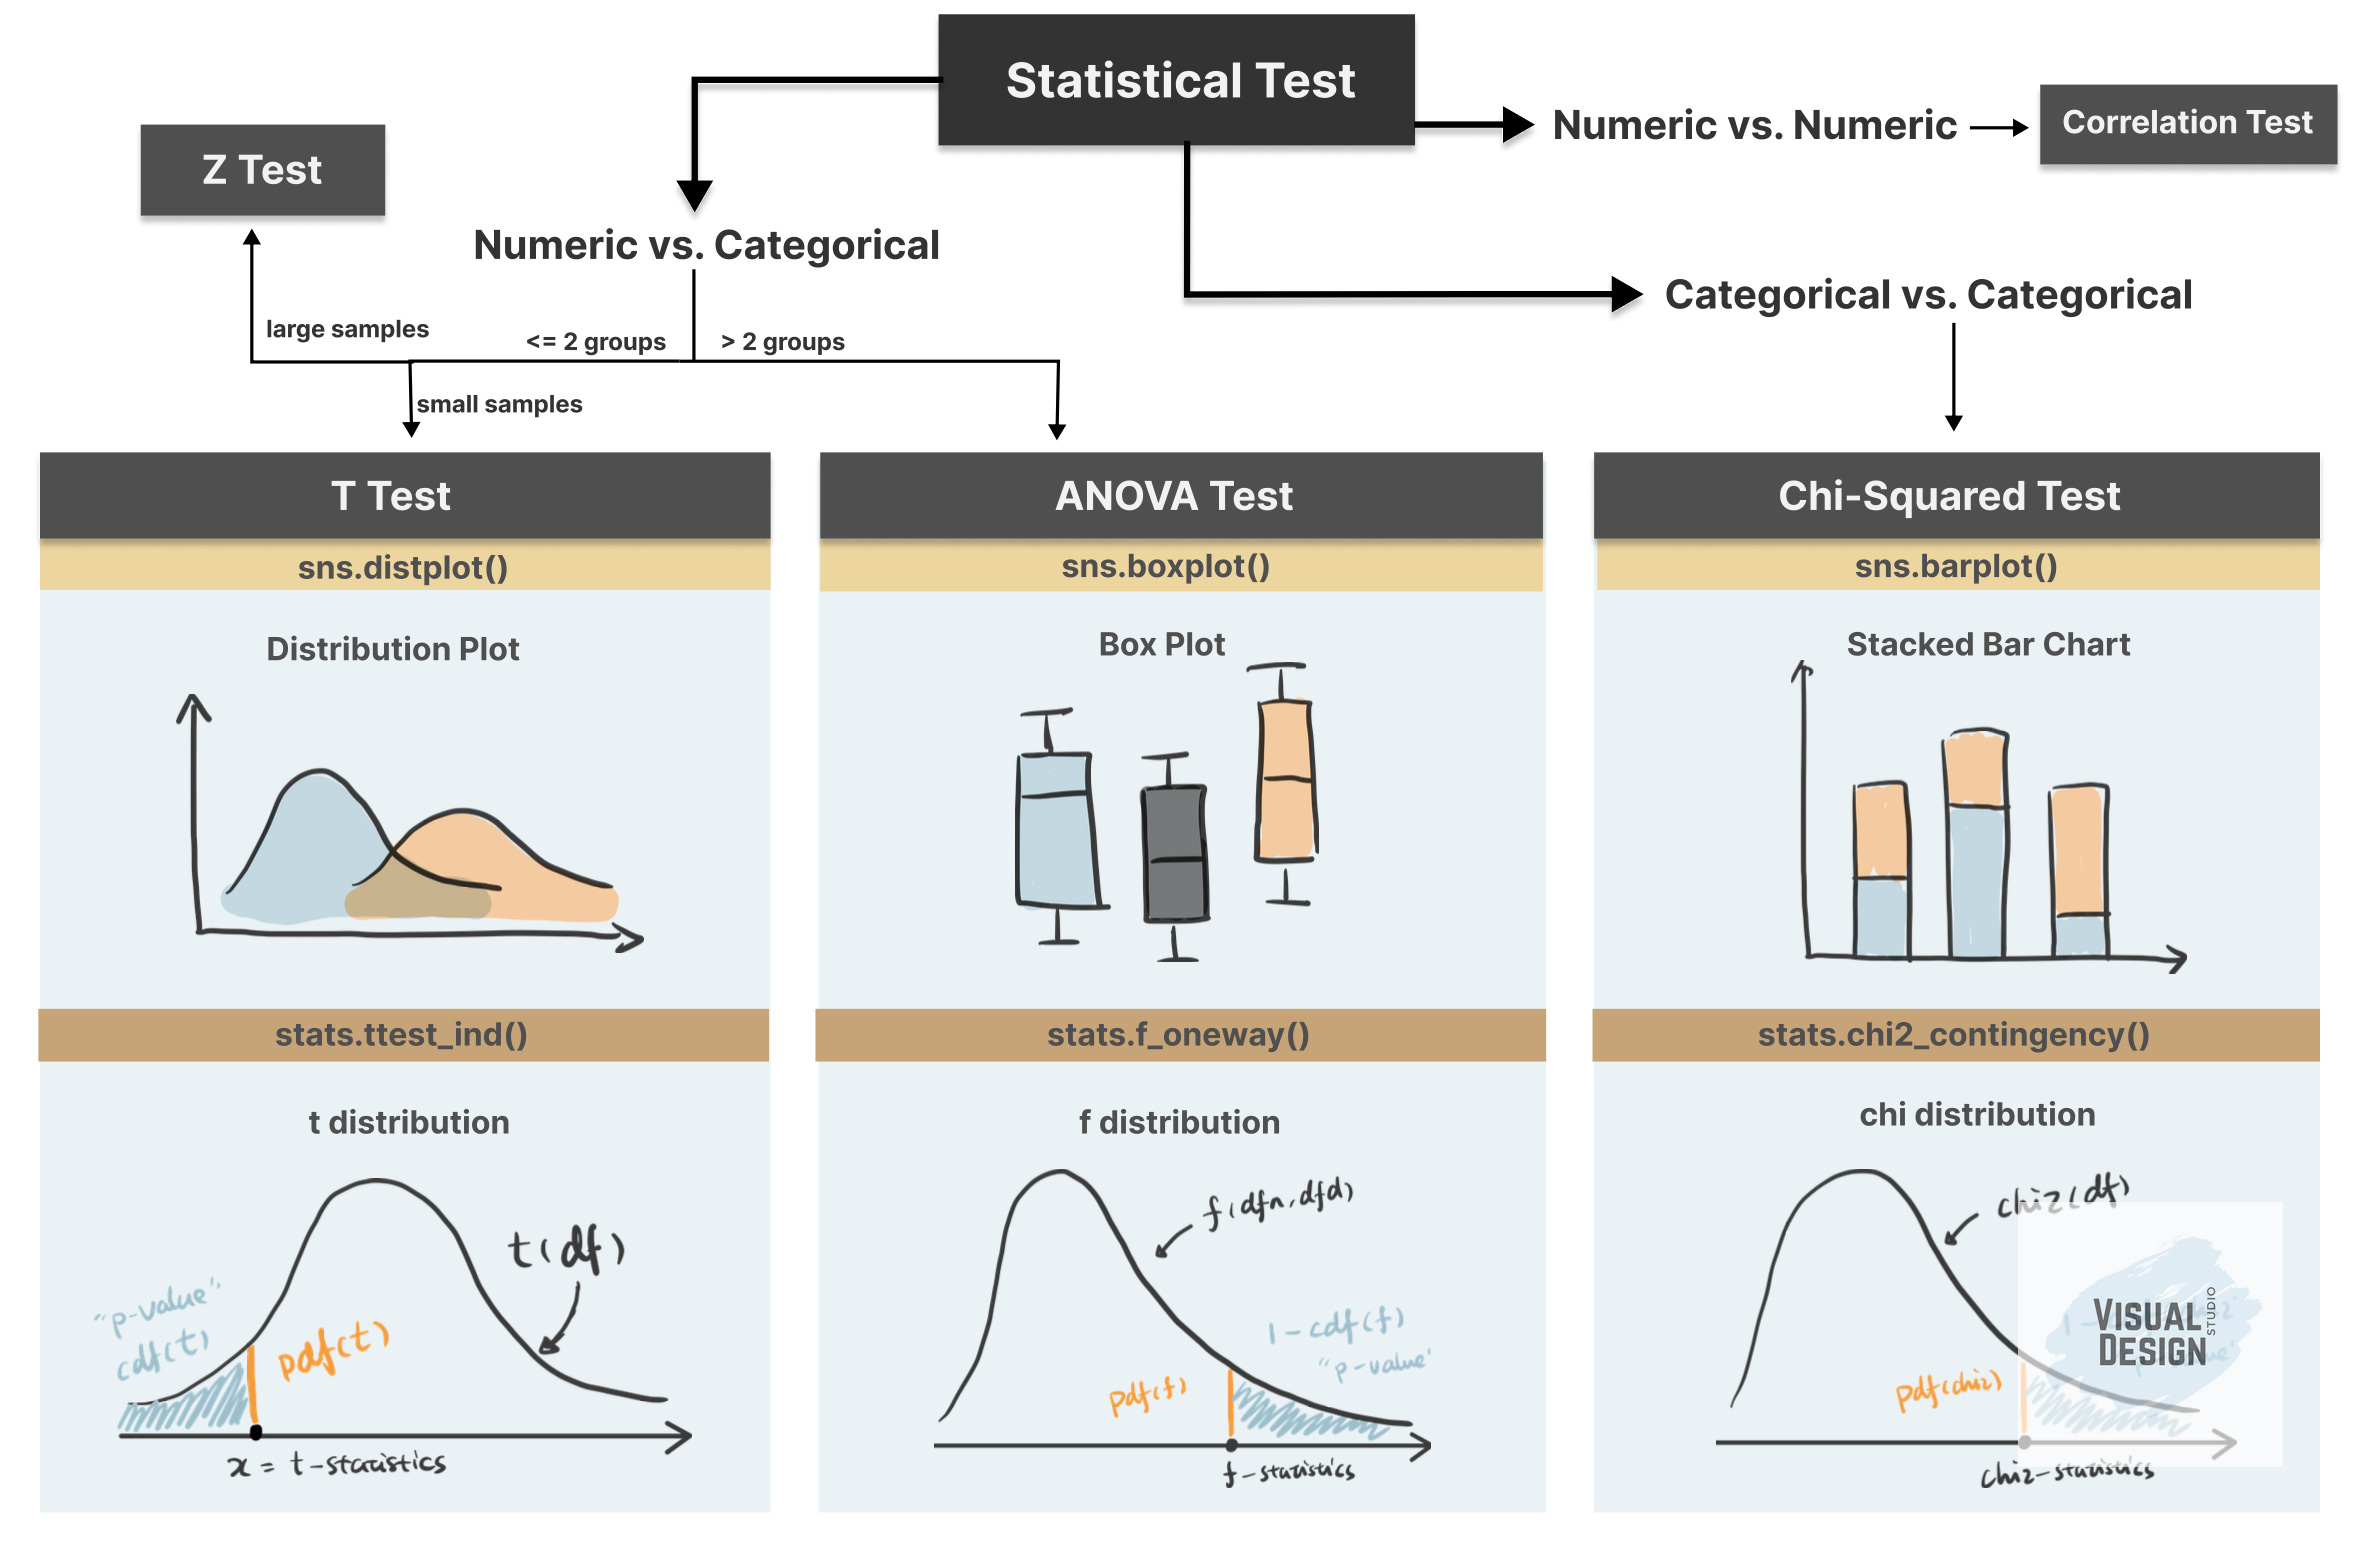
Common Types of Statistical Testing including t-tests, z-tests, anova test and chi-square test.

T-test: compare two groups/categories of numeric variables with small sample size
Z-test: compare two groups/categories of numeric variables with large sample size
ANOVA test: compare the difference between two or more groups/categories of numeric variables
Chi-Squared test: examine the relationship between two categorical variables
Correlation test: examine the relationship between two numeric variables
Step 3. Calculate the p-value
How p value is calculated primarily depends on the statistical testing selected. Firstly, based on the mean and standard deviation of the observed sample data, we are able to derive the test statistics value (e.g. t-statistics, f-statistics). Then calculate the probability of getting this test statistics given the distribution of the null hypothesis, we will find out the p-value. We will use some examples to demonstrate this in more detail.
Step 4. Determine the statistical significance
p value is then compared against the significance level (also noted as alpha value) to determine whether there is sufficient evidence to reject the null hypothesis. The significance level is a predetermined probability threshold - commonly 0.05. If p value is larger than the threshold, it means that the value is likely to occur in the distribution when the null hypothesis is true. On the other hand, if lower than significance level, it means it is very unlikely to occur in the null hypothesis distribution - hence reject the null hypothesis.
For a video guide to these concepts, please check out our YouTube channel 🎬.
Please leave a comment on this post to let me know which topics you’d like me to cover next.
How to Implement T-Test in Python?
We will use Kaggle dataset “Customer Personality Analysis” to demonstrate different types of statistical test. In this article, we will focus on T-Test and the next article will dive deep into ANOVA, Chi-Square.
With large samples, t‑tests, ANOVA, and chi‑square tests often produce very small p‑values even for tiny effects, so hypothesis testing alone is not enough to indicate a practically significant difference and should instead be interpreted together with effect sizes. To demonstrate an appropriate use case of the t‑test, we took a random sample (size 100) from the original dataset:
sampled_df = df.sample(n=100, random_state=100)T-test is used when we want to test the relationship between a numeric variable against different categories of a categorical variable.
There are three main types of t-test.
one sample t-test: test the mean of one group against a constant value
two sample t-test: test the difference of means between two groups. It assumes normality and similar variances in the two groups.
paired sample t-test: test the difference of means between two measurements of the same subject
For example, if I would like to test whether “Recency” (the number of days since customer’s last purchase - numeric value) contributes to the prediction of “Response” (whether the customer accepted the offer in the last campaign - categorical value), I can use a two sample t-test.
The first sample would be the “Recency” of customers who accepted the offer:
recency_P = sampled_df[sampled_df[’Response’]==1][’Recency’]The second sample would be the “Recency” of customers who rejected the offer:
recency_N = sampled_df[sampled_df[’Response’]==0][’Recency’]To compare the “Recency” of these two groups intuitively, we can use histogram (or distplot) to show the distributions.
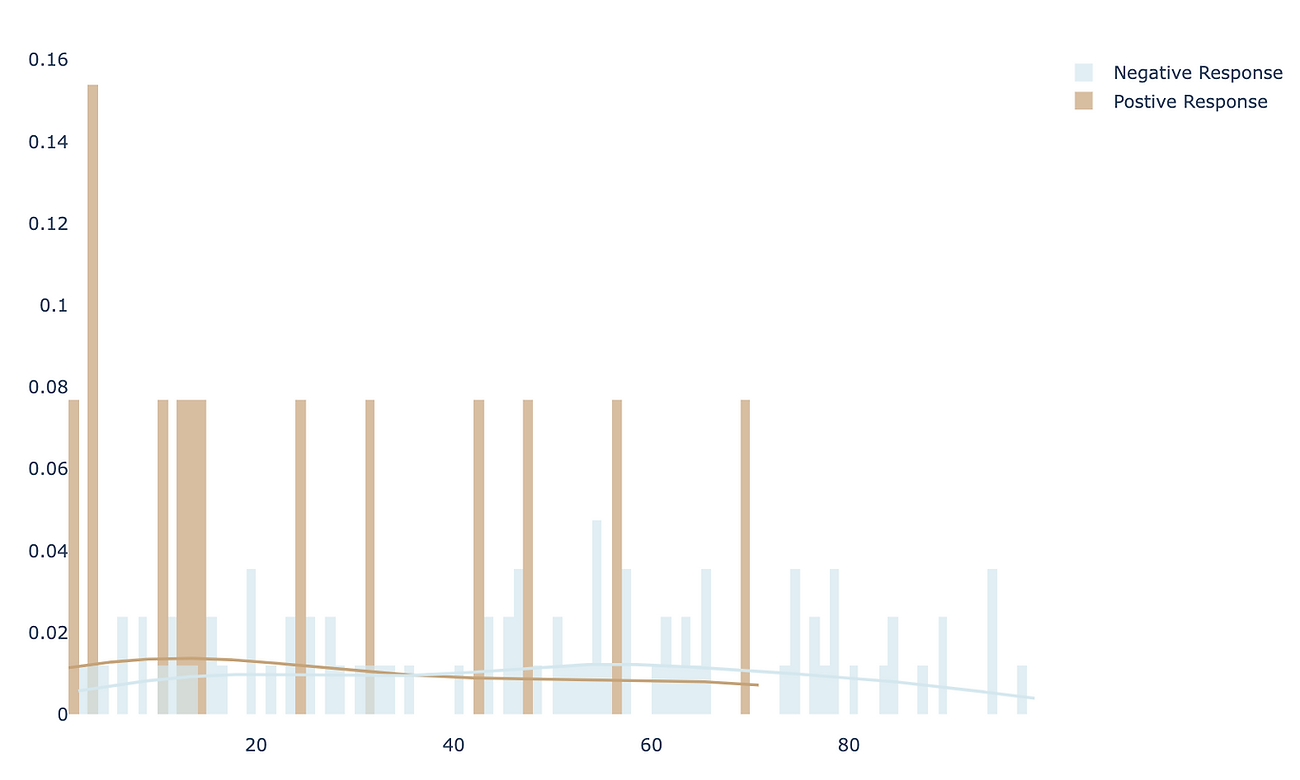
It appears that positive response have lower Recency compared to negative response. To quantify the difference and make it more scientific, let’s follow the steps in hypothesis testing and carry out a t-test.
Step1. define null and alternative hypothesis
null: there is no difference in Recency between the customers who accepted the offer in the last campaign and who did not accept the offer
alternative: customers who accepted the offer has lower Recency compared to customers who did not accept the offer
Step 2. choose the appropriate test
To test the difference between two independent samples, two-sample t-test is the most appropriate statistical test which follows student t-distribution. The shape of student-t distribution is determined by the degree of freedom, calculated as the sum of two sample size minus 2.
In python, simply import the library scipy.stats and create the t-distribution as below.
from scipy.stats import t
rv = t(df=100-2)
Step 3. calculate the p-value
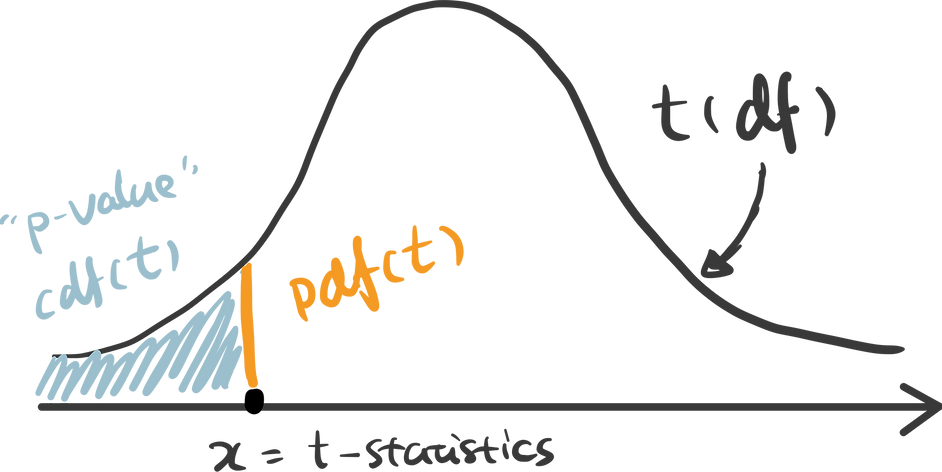
There are some handy functions in Python calculate the probability in a distribution. For any x covered in the range of the distribution, pdf(x) is the probability density function of x — which can be represented as the orange line below, and cdf(x) is the cumulative density function of x — which can be seen as the cumulative area. In this example, we are testing the alternative hypothesis that — Recency of positive response minus the Recency of negative response is less than 0. Therefore we should use a one-tail test and compare the t-statistics we get against the lowest value in this distribution — therefore p-value can be calculated as cdf(t_statistics) in this case.
ttest_ind() is a handy function for independent t-test in python that has done all of these for us automatically. Pass two samples rececency_P and recency_N as the parameters, and we get the t-statistics and p-value.

Step 4. determine the statistical significance
The commonly used significance level threshold is 0.05. Since p-value here (0.024) is smaller than 0.05, we can say that it is statistically significant based on the collected sample. A lower Recency of customer who accepted the offer is likely not occur by chance. This indicates the feature “Response” may be a strong predictor of the target variable “Recency”. And if we would perform feature selection for a model predicting the “Recency” value, “Response” is likely to have high importance.
Please leave a comment on this post to let me know which topics you’d like me to cover next.
Thanks for reaching so far! This post is public so feel free to share it.
